

The Robur ACF gas absorption chiller provides summer cooling without increasing buildings’ electrical demand or electricity use.
A warming climate is making cooling increasingly important for residential buildings (private homes, condominium buildings, schools, ...), industrial buildings (manufacturing facilities, offices, warehouses, ...), and commercial buildings (shopping centers, hospitals, hotels, ...). As temperatures rise, electricity demand increases, and both electricity-generating facilities (power plant) and the distribution network (distribution grid) must meet that demand. Generating and delivering more electricity puts additional strain on this interconnected system, as drought, high temperatures, and extreme events are already limiting its generating capacity or disrupting electricity distribution.
Robur ACF absorption chillers, powered by natural gas or LPG, provide cooling while drawing little electricity. They can therefore reduce demand on the grid during periods of peak consumption and make it easier to keep cooling systems running with much smaller backup generators than an equivalent electric system would require.
Higher temperatures and more persistent heat
The National Academies of Sciences, Engineering, and Medicine report that the average annual temperature in the contiguous United States has risen by about 2.5 °F since 1970. This changes the climate conditions in which buildings and infrastructure must operate. [1]
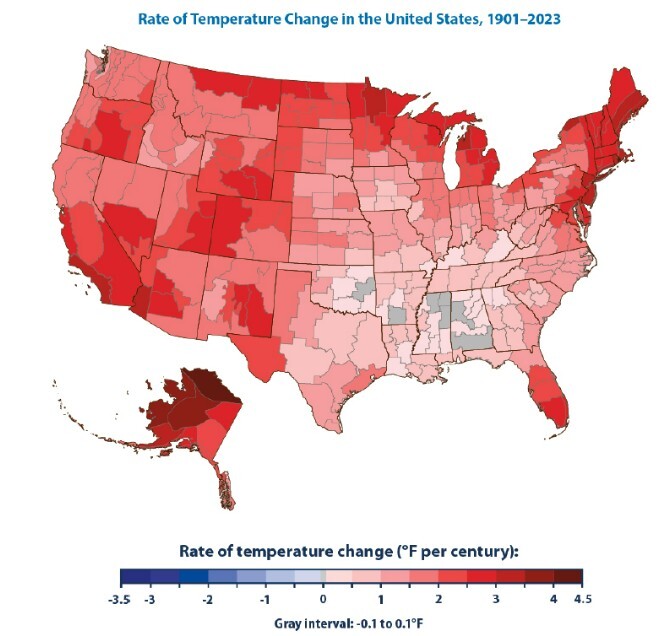
Figure 1 - Observed increase in the contiguous United States from 1901 to 2023.
But that’s not all. Summers are getting both hotter and longer. EPA indicators based on NOAA data for 50 large cities show that heat waves are becoming more frequent and lasting longer.
The average frequency rose from two events per year in the 1960s to six in the 2010s and 2020s, their average duration increased from three to four days, and the interval between the first and last heat wave of the year increased by 46 days. [2]

Figure 2 - Heat waves in 50 large U.S. cities. Analysis of summary figures from EPA and NOAA. The third measure shows how much the interval between the first and last heat wave has increased since the 1960s. [2]
Extreme heat can therefore occur in early spring and persist into late fall, extending the period when the cooling system must remain on.
Higher cooling capacity and energy requirements
Higher temperatures and a longer summer season have two distinct effects: the installed cooling capacity (kW) needed to maintain indoor design conditions increases, and so does the cooling energy (Btu or TON) required by the building.
An analysis of the EIA national series shows that the annual average number of Cooling Degree Days (CDD) rose from 1,047 in 1970–1979 to 1,488 in 2014–2023, an increase of 42%. A year with more CDD means greater cumulative exposure to heat and therefore a greater need for cooling under the same operating conditions (building insulation, system efficiency, ...). [9]
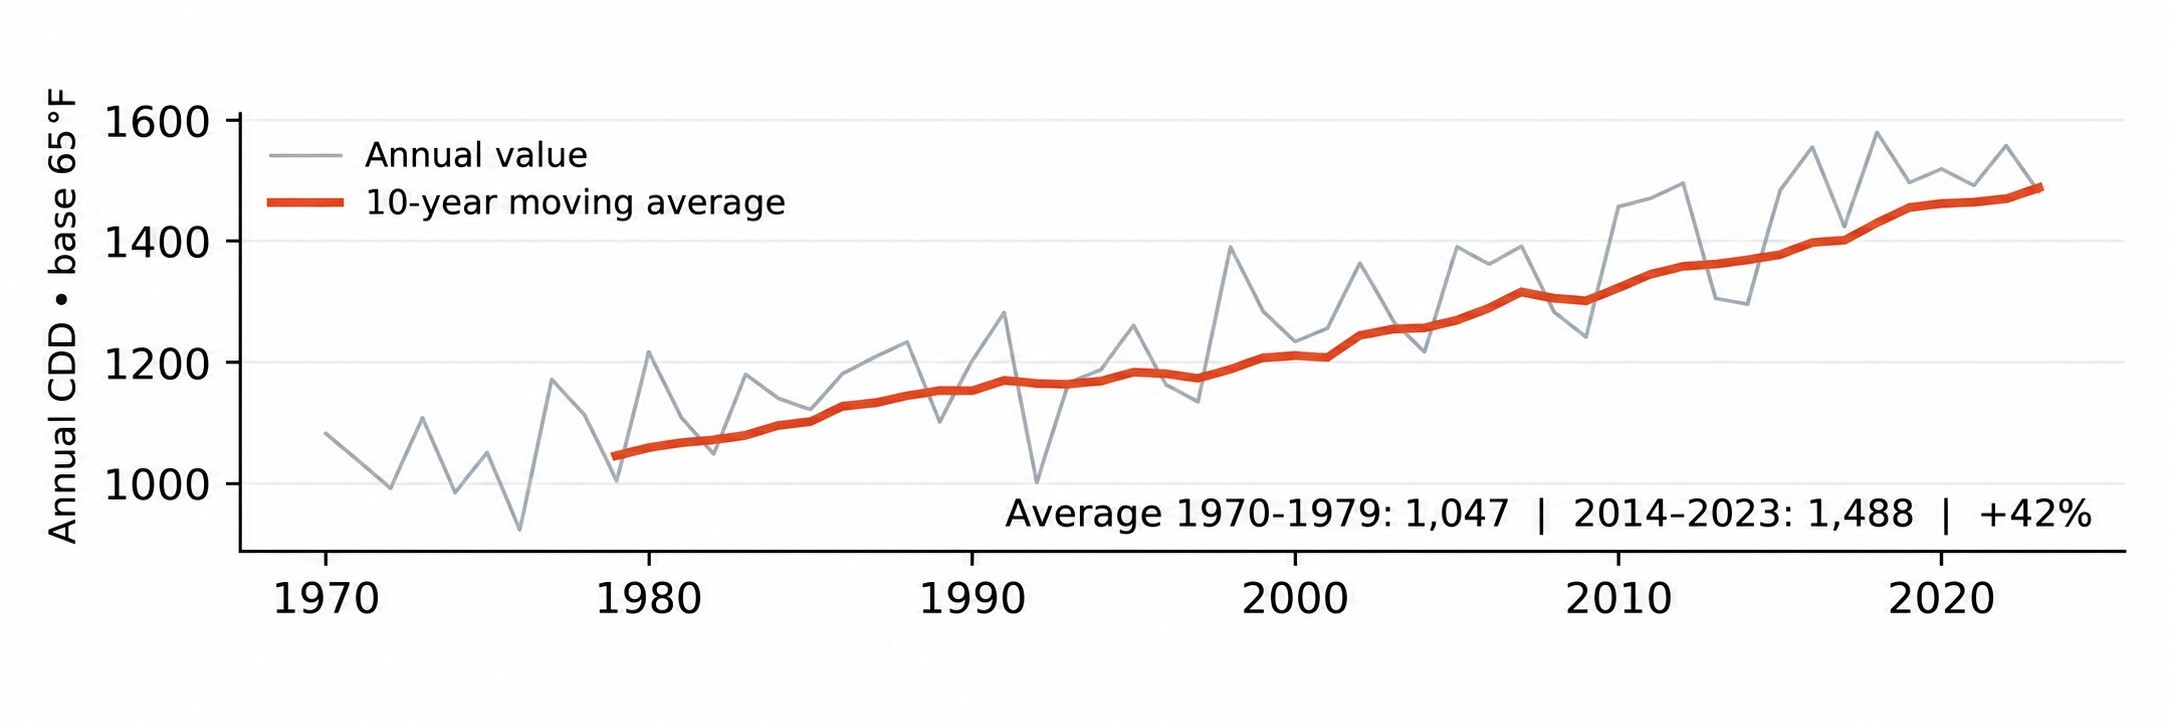
Figure 3 - Annual U.S. CDD, base 65 °F, 1970–2023. EIA data
The effects are evident even in historically temperate regions. The federal Fifth National Climate Assessment notes that during the 2021 extreme heat event in the Pacific Northwest, peak electricity demand in Portland was about one-third higher than in the previous two years. [3]
For owners, designers, and utilities, this means more capacity is needed to serve higher loads during critical hours and more energy is needed for a longer, more demanding cooling season. In conventional electric cooling systems, this translates into both higher electricity demand charges and higher electricity consumption.
Rising demand as power generation and grids come under strain
Chapter 5 of the Fifth National Climate Assessment, published in 2023 by the U.S. Global Change Research Program, describes how heat, lower river flows, and higher water temperatures reduce the capacity and efficiency of gas turbines at thermal power plants and inhibit steam condensation in the cooling system.
Drought and reduced water availability also clearly have a direct impact on hydroelectric power plants. [3]
One observed example comes from the western United States. According to EIA, in the October 2022–September 2023 water year, hydroelectric generation fell 11% from the previous year, reaching its lowest level since 2001. Generation fell by 23% in Washington and by more than 20% in Oregon. [4]
High temperatures also reduce the capacity of power grids to carry electricity and accelerate infrastructure deterioration. Hurricanes, wildfires, and thunderstorms can also damage power lines and substations. A building can therefore lose power even when power plants have enough generating capacity.
Ensuring an adequate supply of electricity for cooling systems therefore depends on having sufficient, properly sized generating capacity and on maintaining the integrity of the local grid. [3]
Power outages are more common and increasingly: both commercial organizations and residential households report experiencing an average of three outages over a two-year period. Power outages tracked by USA Today and PowerOutage.com from 2018 to 2025 reveal extreme volatility in the electric grid’s ability to deliver power.
The research shows that both commercial organizations and homeowners reported experiencing increasingly lengthy power outages — 33% of businesses and 27% of residents reported experiencing a power outage lasting eight hours or more. Aging electric infrastructure continues to degrade reliability, while rising energy demand places additional strain on utilities. At the same time, extreme weather events are becoming more frequent and severe, exposing weaknesses in grid resilience. As a result, many organizations and homeowners are losing confidence in the grid and experiencing the grid’s inability to deliver uninterrupted power.
Therefore, the construction and design community is increasingly responding to these grid instability challenges by incorporating backup power into new projects. Approximately 60% of new homes and 45% of remodels include backup power sources, reflecting a shift in how resilience is prioritized in modern construction. [10]
Robur ACF chillers: Cooling with low electrical demand
Robur ACF chillers use the absorption cycle to produce chilled water, with natural gas or LPG as the primary energy source. The chiller is air-cooled and integrates seamlessly into a hydronic HVAC system with terminal units or air handling units. [8]
| Nominal cooling capacity | 60,500 Btu/h - 5 TON |
|---|---|
| Electrical power draw | 0.75 kW |
| Power supply | 208–230 V - single-phase - 60 Hz |
| Nominal thermal input | 94,900 Btu/h |
| Minimum chilled water temperature | 37°F (ST model) - 10°F (LB model) |
| Maximum outdoor temperature | 122°F (ST model) - 131°F (HT model) |
Source: Robur submittal [8]
The main benefit for users is clear: they can produce chilled water for the building’s cooling system with negligible electrical demand and electricity consumption.
As a result, even during the hottest months, the building’s electrical capacity does not need to be increased. This limits peak electricity demand and leaves capacity available for other equipment.
The financial benefit comes from lower electricity consumption throughout the summer and lower demand charges, since the building’s electrical demand is significantly reduced.
The modular design of the individual 5 TON units also makes it possible to:
- match installed capacity to actual project needs, reducing system oversizing and consequently the capital cost of installing the entire HVAC system;
- run only the units needed under each set of operating conditions, optimizing fuel consumption;
- drastically reduce the cost of purchasing and installing the backup system.
To illustrate this last point, consider a residential building with a cooling load of 10 TON.
Suppose an electric chiller of the same capacity is installed with a nominal COP of 4. It would require about 9 kW of electrical power. Two equivalent Robur ACF absorption chillers, by comparison, draw only 1.5 kW, or about one-sixth as much, because gas, whether natural gas or propane, provides most of the energy needed to operate the Robur units.
An electrical load this low reduces the overall strain on the power generation and distribution system and allows a much lower-capacity backup generator to be installed, with clear benefits in terms of investment, footprint, and consumption.
Robur ACF can cool residential buildings, schools, hotels, public buildings, and commercial and industrial facilities even under particularly demanding operating conditions. The HT (High Temperature) model extends the operating range to outdoor temperatures of up to 131°F, while the LB (Low Brina) model can produce chilled water as cold as 10°F, making it suitable for a range of medium-temperature industrial refrigeration applications [8].
Sources and references
Sources accessed in November 2026.
Figures 1–2: summary of published data.
Figure 3: analysis of the EIA series.
Reference [8] contains manufacturer data.
The comparison on page 5 is an example with explicit assumptions.
[1] National Academies of Sciences, Engineering, and Medicine
Effects of Human-Caused Greenhouse Gas Emissions on U.S. Climate, Health, and Welfare, 2025. Chapter 3.
https://www.nationalacademies.org/read/29239/chapter/5
[2] U.S. Environmental Protection Agency
Climate Change Indicators in the United States, Fifth Edition, July 2024. Heat Waves and Heating and Cooling Degree Days sections. EPA 430-R-24-003.
https://nepis.epa.gov/Exe/ZyPURL.cgi?Dockey=P101AXFE.TXT
[3] U.S. Global Change Research Program
Fifth National Climate Assessment, 2023. Chapter 5, Energy Supply, Delivery, and Demand. See especially pp. 5-6–5-9. DOI 10.7930/NCA5.2023.CH5.
https://toolkit.climate.gov/NCA5_Ch5_Energy
[4] U.S. Energy Information Administration
Western U.S. hydropower generation fell to a 22-year low last year, March 26, 2024. Water year from October 2022 to September 2023.
https://www.eia.gov/TodayinEnergy/detail.php?id=61645
[5] U.S. Department of Energy — CESER
Hurricane Beryl, Update #4, July 11, 2024. Situation Report, Electricity Sector Summary.
https://www.energy.gov/sites/default/files/2024-07/TLP-CLEAR-DOE-Situation-Report-Beryl-04-clean.pdf
[6] Pacific Northwest National Laboratory
Building America Solution Center. Emergency Air Conditioning and Food Refrigeration. Guide to emergency cooling and backup power.
https://basc.pnnl.gov/resource-guides/emergency-air-conditioning-and-food-refrigeration
[7] U.S. Department of Energy
Combined Heat and Power Technology Fact Sheet — Absorption Chillers for CHP Systems. Better Buildings & Better Plants Initiative.
https://betterbuildingssolutioncenter.energy.gov/resources/combined-heat-and-power-technology-fact-sheet-absorption-chillers-chp-systems
[8] Robur
https://www.robur.com/en-us/support/presales/products-literature?filtro_prodotto_en_us=50316231950
[9] U.S. Energy Information Administration
Monthly Energy Review, Table 1.12, Cooling Degree-Days by Census Division. U.S. series ZWCDPUS, annual data, base 65 °F, population-weighted. Analysis of the 1970–1979 and 2014–2023 averages.
https://www.eia.gov/totalenergy/data/browser/?tbl=T01.12
[10] THE PROPANE EDUCATION & RESEARCH COUNCIL
Propane and the Future of Power


Comments